Blog
What is Trend in Forex?
While the importance of following the trend is a well known fact to all, some beginner traders do not always understand clearly enough what the trend is all about. Moreover, it is important that one understands how to identify the trend. This is just what we shall be discussing hereunder.
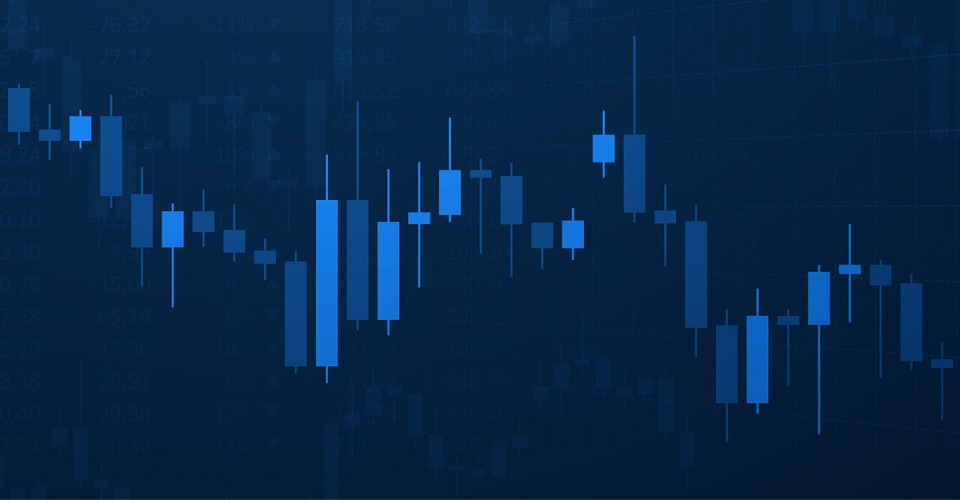
In a nutshell, the Forex trend is the direction that the price is moving towards over a particular period of time. This leads to the majority of the traders to move in the direction the price is following. The trend is described as being bullish if it is an upward trend, or bearish if it is a downtrend. Successively higher highs and lows on a chart indicate a bullish trend, while a series of lower highs and lows demonstrates that there is a bearish trend.
While the former are the most important types of trends, there is also the sideways trend. This is also referred to as the horizontal trend or a flat market, as there is no pronounced trend. In such a case the forces of demand and supply are practically equal or very similar to one another, and so the price consolidates with a horizontal movement. Once the price breaks this channel, it is generally a sign that a new trend has begun.
As a trader you need to know the trend that is dominating the market so as to act accordingly. Trends can help you reduce the risk of suffering losses, as well as improve your chances of doing well and earn more.
There are different ways how you can identify the direction of a trend. At first you may feel a bit unsure, but over time it will get easier to identify trends.
Sometimes the trend can be determined easily by examining trading charts. By drawing a parallel line to the price chart you can ascertain whether it is directed upwards or downwards.
You may also use the trend lines. To plot these you can draw a line through the successive highs and lows. If you can see that it is going up then the market is following a bullish trend, and vice versa.
Another option is to use technical indicators. There are various ones that a trader can use, and each serves different purposes. Some of the most popular technical indicators include:
- The Moving Average this is often used to determine the market trend. If the angle of the moving average lines is in an upward direction, the trend is bullish, and vice versa. In case the lines are interlaced then there is a sideways trend. The location of the price also shows the trend since if it is above the moving average, then the market is dominated by bulls, and vice versa.
- Fractals, this is a technical indicator which is also used often. If a fractal forms above a previous one, then there is an uptrend, while if it is below, there is a downtrend.
- Parabolic SAR, dots are formed so as to identify the trend. If they form above the price then the bears are dominating the market, and vice versa.
- MACD Histogram an uptrend is noticed when the bars are above the zero level, and if every subsequent bar is higher than previous bars.
We hope that by using any one of more of the above methods to determine the current trend you will be able to identify the correct data, so that your decisions can be ideal ones, ad then the trend will indeed be your friend!