Blog
Support and Resistance Forex
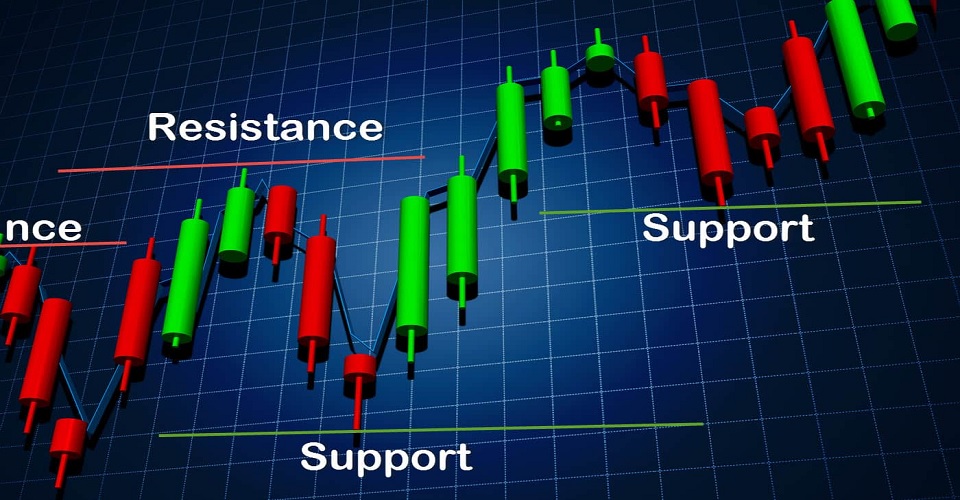
The Support and Resistance levels are often mentioned among traders. In financial markets these levels are important as they accurately indicate how the forces of supply and demand interact together so as to determine the price of an asset. As long as the supply outstrips the demand, prices tend to fall. The basic strategy is to buy an asset while prices are at support level, and then sell when the prices are at resistance level.
Please bear in mind that the support and resistance levels aren’t exact price points. They are zones, and as such demand and supply can change. Hence the importance of monitoring consistently to make the most of opportunities.
There are different types of support and resistance levels:
- Fixed support and resistance levels, these are fixed and so cannot change. They will be invalidated in cases when the prices manage to break either above or below them. Round numbers and all-time highs and lows are examples of such levels.
- Dynamic support and resistance levels, these change according to the price and time. Prices are subject to new forces of demand and supply. Some indicators include Moving Averages and Bollinger Bands.
- Semi-dynamic support and resistance levels, these change at either a fixed or predetermined rate. Some indicators include the Fibonacci tool, Pivot Points and Trendlines.
Many traders are unsure how to locate the support and resistance levels. Here are some tips and guidelines in this regard:
- Peaks and Troughs plotting involves marking the visible highs and lows on the chart. The highest highs and the lowest highs demonstrate the resistance levels, while the lowest and highest loses establish the support levels. Longer timeframes are recommended for more reliability.
- Fibonacci levels. Fibonacci retracements help the trader to locate the best entry points, while the Fibonacci extensions help to establish the ideal target points in a trending market. Support lines are the uptrends and resistance lines are the downtrends in the case of Fibonacci retracement lines, and vice versa for the Fibonacci extension lines.
- Pivot Points utilises the open, high, low and closing prices so as to derive multiple lines that will then serve as the support and resistance levels in the market. This is done mathematically. Seven lines are plotted, three support lines, three resistance lines and one pivot point.
- Trendlines in the case of an uptrend the trendline is drawn from one low, to other higher lows, and this line acts as a semi-dynamic support line. On the other hand in a downtrend, the trendline is drawn from a particular high, moving on to connect lower highs and projecting the line into the future to act as a semi-dynamic resistance line.
There are a number of online trading strategies which use support and resistance levels, including:
- Range trading used in markets that do not have a clear trend, and the strategy is to look for buy trades when the prices are close to the support level, and to sell trades when the prices are near the resistance level.
- Breakout trading prices tend to breakout following a period of consolidation, and here traders cease the opportunity. The breakout is generally at the start of a new trend. When price breaches the support line, traders should look to place sell orders, and vice versa. Traders should however be on the lookout for possible fake breakouts where the breach is only for a short period.